Decode Topo Maps: Contour Interval Explained Simply!

Topographic maps, crucial tools for understanding terrain, represent elevation changes through contour lines; the United States Geological Survey (USGS) employs these maps extensively. The vertical distance between these contour lines, known as what is the contour interval on a topographic map, is a fundamental aspect for interpreting terrain steepness. Precisely, the contour interval reveals the elevation change between adjacent contour lines, a key concept when using tools such as a compass and navigating using topographic maps. Understanding what is the contour interval on a topographic map is therefore essential for both experienced hikers and cartography enthusiasts to avoid misinterpreting the lay of the land.

Image taken from the YouTube channel PerryScience , from the video titled Calculating the Contour Interval on a Topographic Map .
Understanding Contour Intervals on Topographic Maps
This explanation will guide you through understanding contour intervals on topographic maps, with a focus on identifying what they represent and how to interpret them. A topographic map provides a three-dimensional representation of the Earth's surface on a two-dimensional plane. Contour lines are a crucial element in achieving this representation.
What Are Contour Lines?
Contour lines are imaginary lines that connect points of equal elevation on a map. Imagine walking along a contour line; you would neither ascend nor descend, but remain at the same height above sea level. Each contour line represents a specific elevation.
What is the Contour Interval on a Topographic Map?
The contour interval is the vertical distance between adjacent contour lines on a topographic map. It represents the amount of elevation change between each successive line.
Why is the Contour Interval Important?
The contour interval tells you how much elevation changes between each line. This is essential for visualizing the steepness or flatness of the terrain. A small contour interval means elevation changes are shown with greater precision.
Determining the Contour Interval
The contour interval is typically indicated in the map legend. Look for a statement like "Contour Interval = 20 feet" or "Contour Interval: 10 meters." This value is constant for the entire map sheet (unless otherwise noted), meaning the elevation difference between every two adjacent contour lines remains the same.
How to Interpret Contour Intervals
Understanding the contour interval allows you to extract valuable information about the terrain.
Steep Slopes vs. Gentle Slopes
- Closely Spaced Contour Lines: Indicate a steep slope. A rapid change in elevation occurs over a short horizontal distance.
- Widely Spaced Contour Lines: Indicate a gentle slope or relatively flat ground. The elevation changes gradually over a longer horizontal distance.
Identifying Specific Terrain Features
Contour lines, along with the contour interval, help identify specific features.
- Hills: Represented by a series of concentric, closed contour lines. The elevation increases towards the center.
- Depressions (Pits or Basins): Also represented by closed contour lines, but with hachure marks (short lines) pointing inward towards the lower elevation.
- Valleys and Ridges: Valleys are indicated by contour lines forming a "V" shape, with the point of the "V" pointing uphill (opposite to the direction of water flow). Ridges are indicated by contour lines forming a "V" shape, with the point of the "V" pointing downhill.
- Water Features: Contour lines often bend upstream when crossing a stream or river. The closer spacing of contour lines near water features often indicates steeper banks.
Examples of Contour Interval Interpretations
| Scenario | Contour Interval | Interpretation |
|---|---|---|
| Mountainous terrain | 40 feet | Elevation changes drastically; expect steep slopes. |
| Rolling hills | 20 feet | Moderate elevation changes; expect a mix of gentle and steeper slopes. |
| Flat plains | 5 feet | Very little elevation change; mostly flat terrain. |
Common Contour Interval Conventions
While contour intervals are specific to the map, some conventions are common:
- Smaller Scale Maps (e.g., Regional Maps): Generally use larger contour intervals to represent broad elevation changes.
- Larger Scale Maps (e.g., Local Area Maps): Typically use smaller contour intervals to show detailed terrain variations.
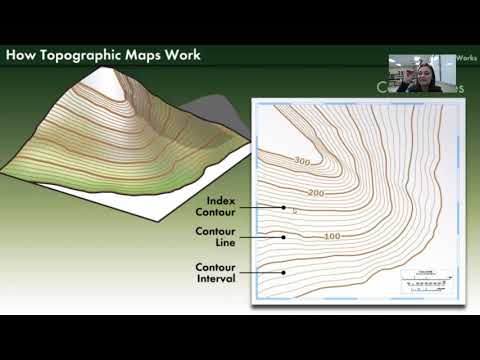
- Index Contours: Every fifth contour line is usually drawn darker or bolder and labeled with its elevation. This helps in quickly determining elevations and orienting yourself on the map. For instance, if the contour interval is 20 feet, index contours might be at intervals of 100 feet (0, 100, 200, 300, etc.).
Video: Decode Topo Maps: Contour Interval Explained Simply!
FAQs: Understanding Contour Intervals on Topo Maps
Here are some frequently asked questions to help you better understand contour intervals and how they are used to interpret topographic maps.
How does the contour interval relate to the terrain's steepness?
A smaller contour interval indicates flatter terrain because the elevation changes are represented at closer intervals. Conversely, a larger contour interval represents steeper terrain, where elevation changes rapidly over the same distance.
How do I find the contour interval on a topographic map?
The contour interval is typically found in the map legend. It's usually written as "Contour Interval = [Number] feet/meters". This number indicates the vertical distance between adjacent contour lines.
What happens if contour lines are very close together?
Very closely spaced contour lines indicate a steep slope or even a cliff. This signifies that the elevation changes dramatically over a short horizontal distance. It's a crucial observation for understanding the terrain's steepness.
Why is understanding the contour interval important?
Understanding the contour interval is vital for accurately interpreting topographic maps. Knowing what is the contour interval on a topographic map allows you to visualize the three-dimensional shape of the land, assess slope steepness, and plan routes effectively. It also allows the user to avoid potential obstacles or hazards.